Pest observation
- Date
- Today
- Description
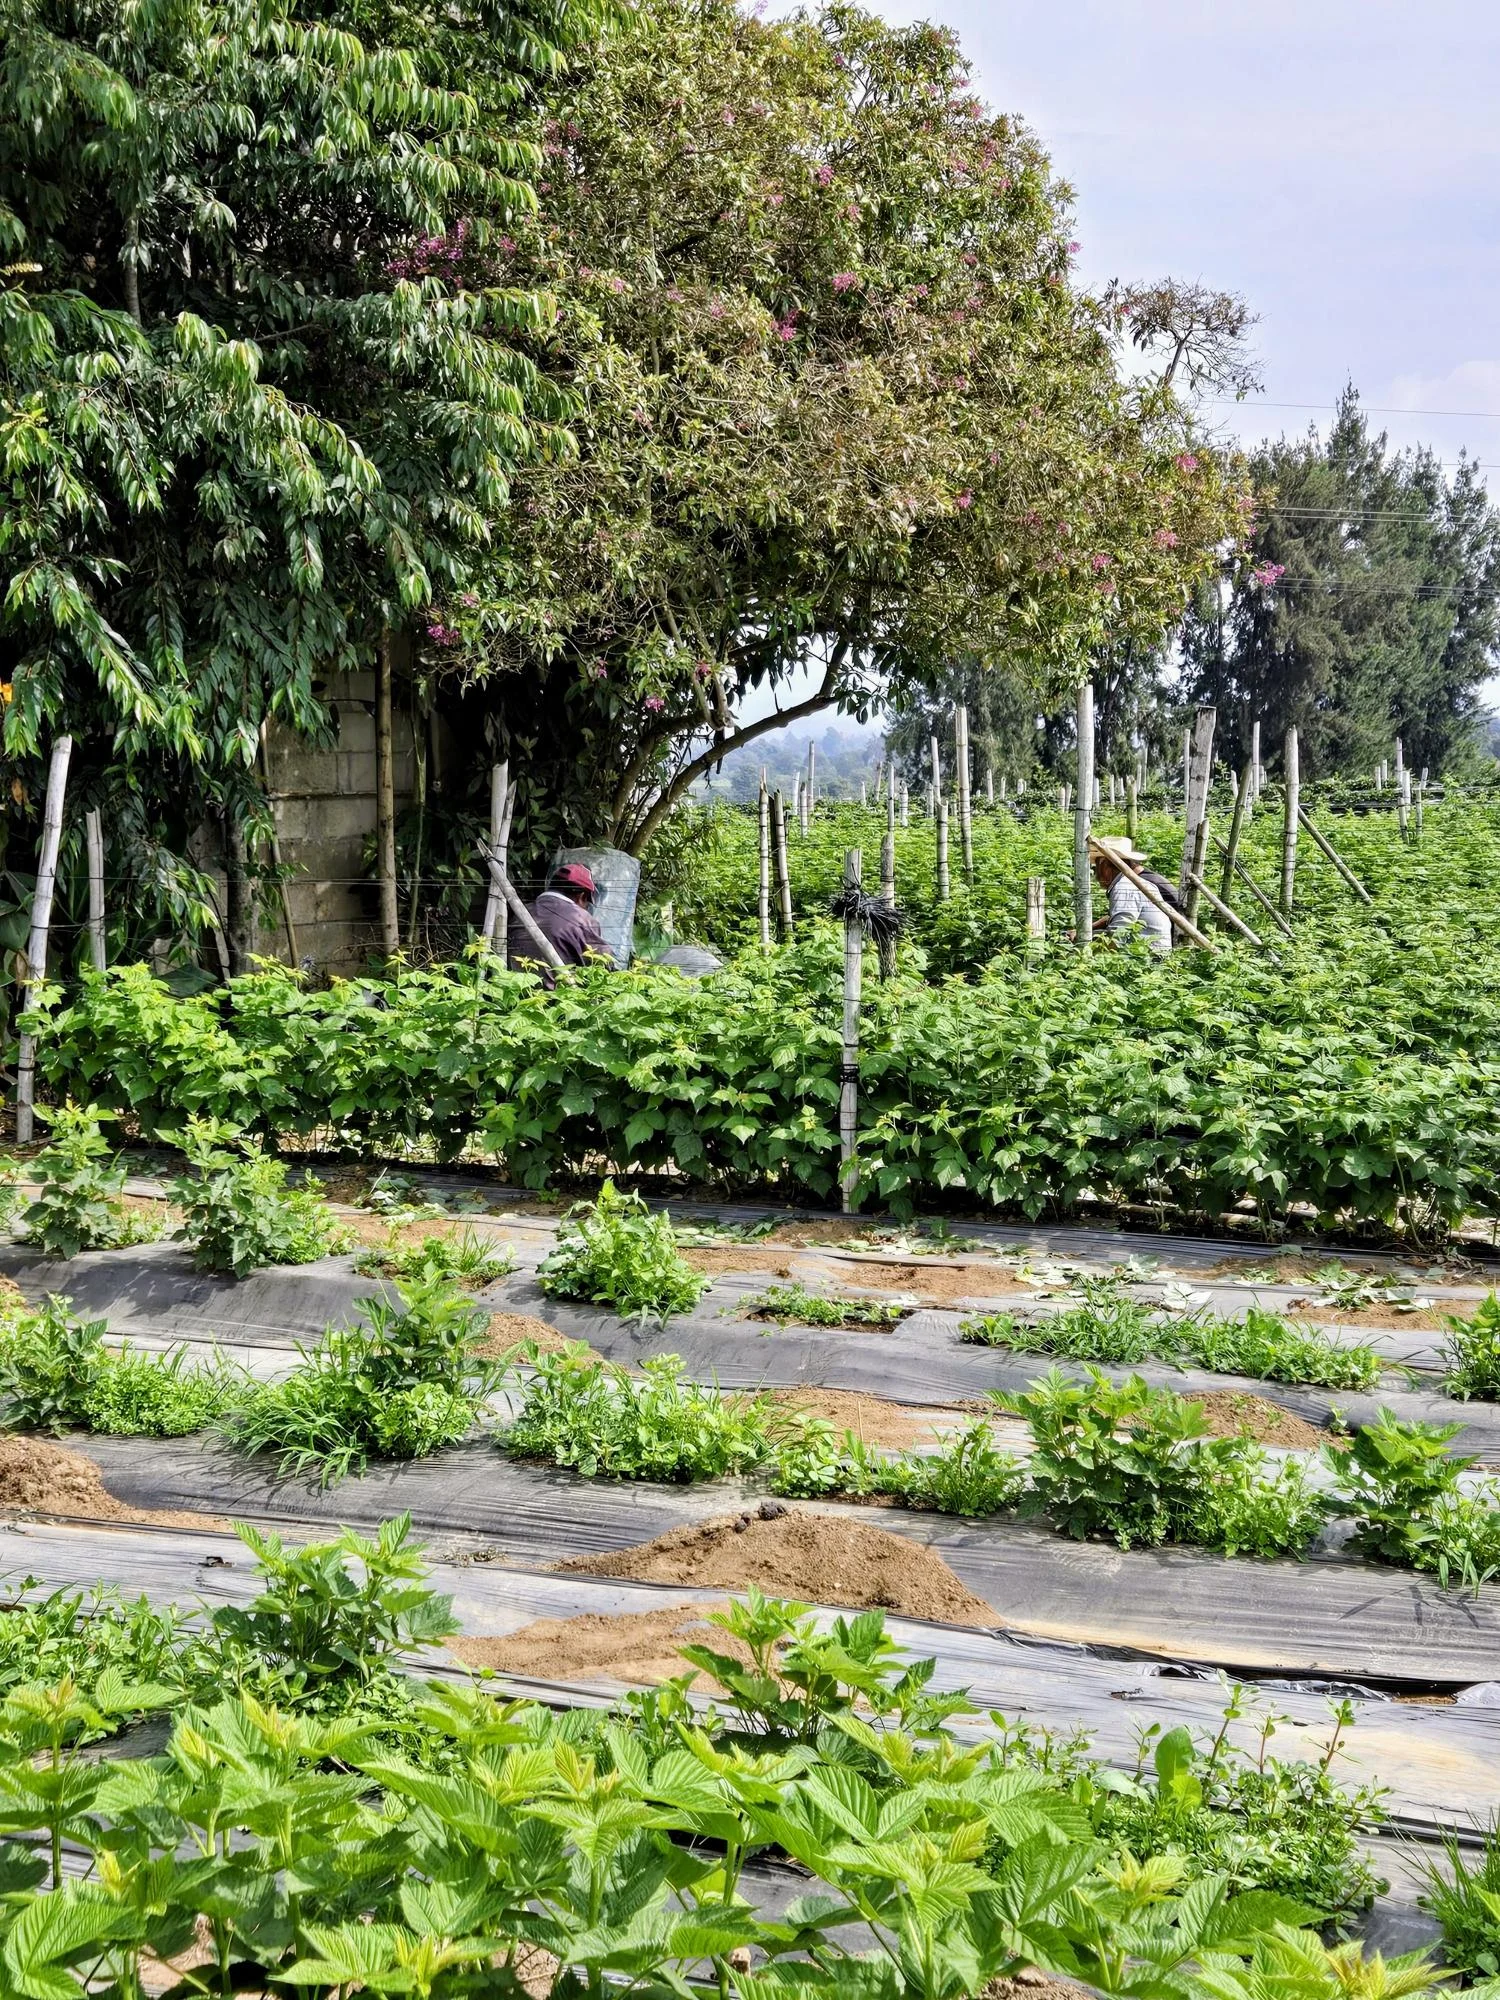
- Aphids observed on the leaves

Record your farm activities by voice and access them whenever you need to.
More than 200 hectares under monitoring across 3 countries.
Log irrigation and the signs of pests and diseases you observe, using your voice.
Say what you applied, how much and in which plot. The activity becomes part of your history.
For example: monitor Black Sigatoka, based on your records and crop context.
Review daily progress and water and input use, based on what you recorded.

Describe the activity and access the record in your history.
Review activities by farmer, farm and plot in Studio.
Review metrics and alerts based on available information.
Prioritize visits and keep supporting your farmers.

View your farmers’ farms and plots.
Follow your farmers' progress and coordinate support with up-to-date records.
Prioritize visits and maintain assistance between field rounds.
Review traceability of activities and inputs recorded on supplier farms.
Also for farms, institutions and NGOs
These metrics belong to your operation. They are built from the activities your farmers record.
The available information depends on what is recorded: quantities, units, dates and plots. Without these details, the corresponding metric cannot be calculated.